ESTHub is the national satellite data center that enables convenient discovery, viewing, processing, and downloading of satellite data. Unlike detailed orthophotos, which Estonian Land and Spatial Development Board collects via airplane over longer time intervals, satellites operate regularly, providing quicker information about landscape changes.
At the national level, ESTHub serves as the solution for developing various services and applications related to satellite data. The existence of such a platform enables the establishment of unified principles for different developments and needs, allowing the full potential of ESTHub to be realized. ESTHub provides the opportunity to create operational remote sensing services, which can optimize workflows in the public sector.
ESTHub signed an agreement with the European Space Agency in 2016, enabling the operational display, download, and mass processing of Copernicus program data on ESTHub platforms. In addition to information from Sentinel satellites, ESTHub also collects Landsat-8 data, offering services and processing capabilities to support diverse use of satellite datasets. Data
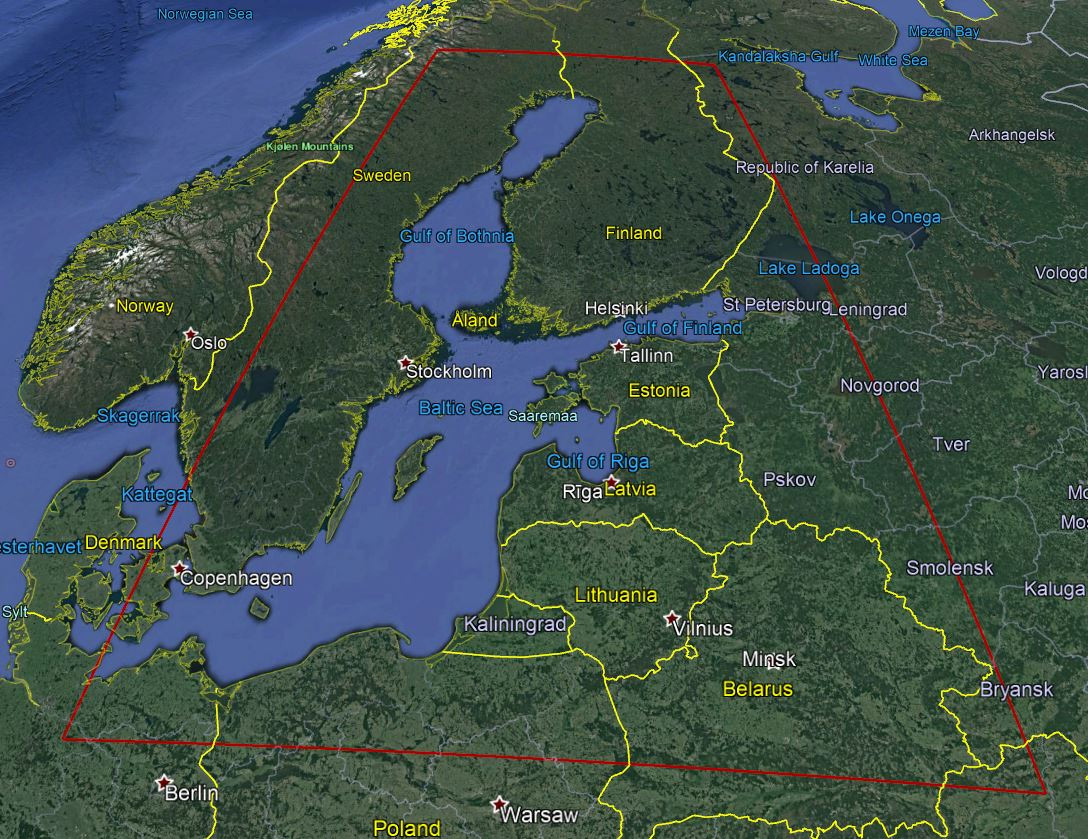
ESTHub gathers satellite data for the Estonian area of interest. For Sentinel 1 and 2, but also for Landsat 8, ESTHub offers data about 200 km beyond state borders (Figure 1), for Sentinel 3 the area of interest covers the Baltic Sea and its surrounding area (Figure 2).

It is important to reference properly when using Copernicus data.
If you register (or you have been registered) for ESTHub's services, you will agree to the Land and Spatial Development Board's rules for processing personal data.
Contracted users can perform large-scale processing of satellite data on a computing cluster with access to raw data. One option is to use the web interface of the processing portal called Calvalus. The excellent performance of Calvalus is primarily due to its ability to process workflows in parallel and execute code directly at the data’s location. For operational services or more complex periodic processing, the infrastructure also offers flexible options for running code without the need for a graphical interface.
Since data processing and analysis often require flexibility and collaboration, ESTHub also provides a JupyterHub environment. JupyterHub allows users—whether scientists, data analysts, or officials—to have a personal workspace on a shared server.
ESTHub includes tools that not only enable efficient data processing but also allow visual analysis of results. One such tool is xcube, which facilitates the transformation of Earth observation data into analysis-ready data cubes. In addition to data processing, xcube enables users to easily visualize results, such as time series and graphs.
For those who simply want to view satellite images easily and conveniently without specialized expertise, the web application Satiladu provides an excellent solution. The data is updated daily and is available by the evening of the same day. The Satiladu search page provides service addresses for viewing satellite images in GIS programs, and clicking on a satellite image allows users to navigate to an internal application. Within this application, users can view satellite images in different spectral combinations, create custom map layers, and share them with others (read more).
The European Space Agency’s satellite Sentinel-2 produces daily images in both visible light and a broader spectral range of 433 nm to 2280 nm. One point (pixel) on the image corresponds to 10 meters in nature.
The Estonian Land Board’s Satiladu allows users to daily view information about a freely chosen area within Estonia:
- A standard color photograph from the satellite, which can be compared with an aerial photograph of the same area;
- Visualizations for analyzing different land cover types and updating relevant information:
- So-called index maps:
- The NDVI index map, calculated using near-infrared radiation and the red wavelength, for assessing the intensity and spread of vegetation growth;
- The NDPI index map, calculated using shortwave-infrared radiation and the green wavelength, for distinguishing water edges of water bodies;
- So-called false-color maps, created by replacing one or more components of the "red-green-blue" combination with intensities measured in wavelengths invisible to the human eye:
- NRG - "near-infrared-red-green" - for visualizing winter land cover;
- NGR - "near-infrared-green-red" - for highlighting different landscape types;
- So-called index maps:
- User-customized and tuned false-color maps for exchanging different data research ideas with colleagues.
The above-described map layers are available in Satiladu and can be compared with each other across the entire Sentinel-2 archive, starting from July 11, 2015.
ESTHub was financed by the European Regional Development Fund instrument in the amount of 410 336,69 €. More detailed information on The State Shared Service Centre web page (in Estonian).

Access to the Services
Contact
For questions and concerns, please contact esthub@maaruum.ee